Cloudless: global cloudless composite coverage based on the VANE platform

Posted on 19 Dec 2017
By: Anton Sonyushkin
Lead Data Science Engineer, OpenWeather
By: Anton Sonyushkin
Lead Data Science Engineer, OpenWeather
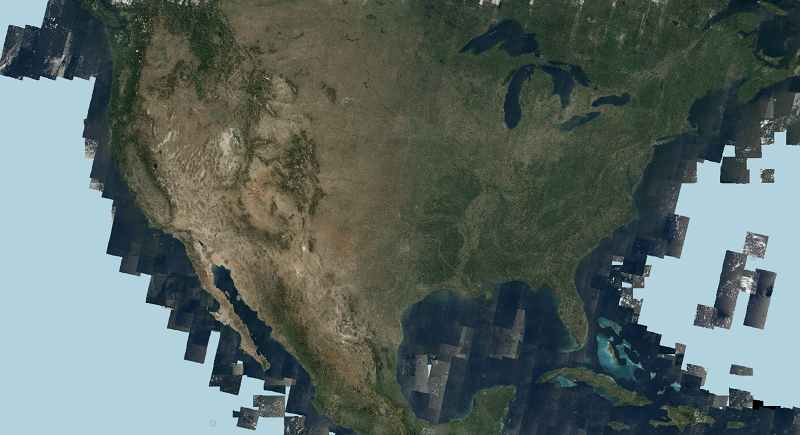
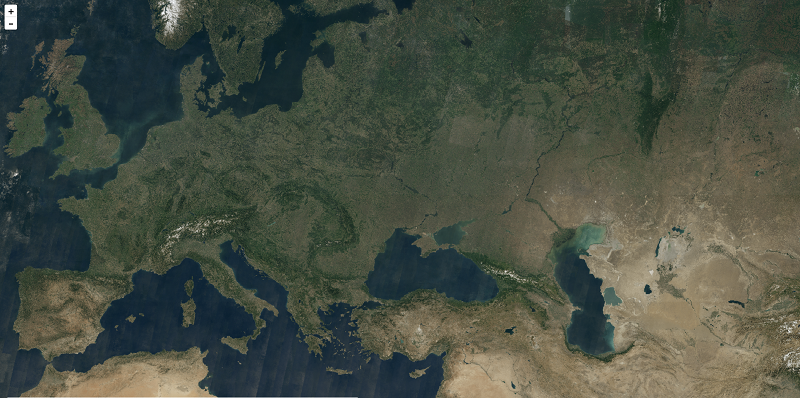
The drawings below show global coverage obtained between 1 June 2017 and 1 September 2017 using data from the MODIS spectroradiometer aboard KA Terra and Aqua.
The current cloudless coverage of the Earth by medium and low-resolution satellite images is an important element in the regional and global systems that monitor the territorial changes caused by natural and man-made factors. For example, assessing the damage inflicted by forest fires caused by deforestation, volcanic eruptions, flooding and so on. Also, such types of coverage are popular as the base layer for cartographic web services.
The main stages of creating such coverage are: the selection of images, the masking of clouded areas, tonal adjustment of images taken at different times of the year, and pasting them into single coverage using so-called “cutlines”, which enable, to a certain extent, the joins between the pasted images to be hidden. Such operations, as a rule, are carried out in semi-automatic mode and require specialised software and highly qualified experts, which substantially increases both the time taken to create such a product and its cost.
We have designed and delivered a completely different approach to producing such coverage. At the heart of this approach lie the principles used in processing Big Data and machine-learning algorithms. The technology we have implemented allows us to obtain, in a fully automatic mode, the very best coverage, in terms of cloud cover, of the Earth for a specified timeframe. Not only this, but the technology we use for data preprocessing means that a composite product can be obtained using either one or several different data sources. To obtain a composite image, we carry out a pixel-by-pixel analysis of all images stored in our database for a specified timeframe. As a result, a single value, the best in terms of cloud cover, is selected. By assembling such values from there, complete coverage is produced.
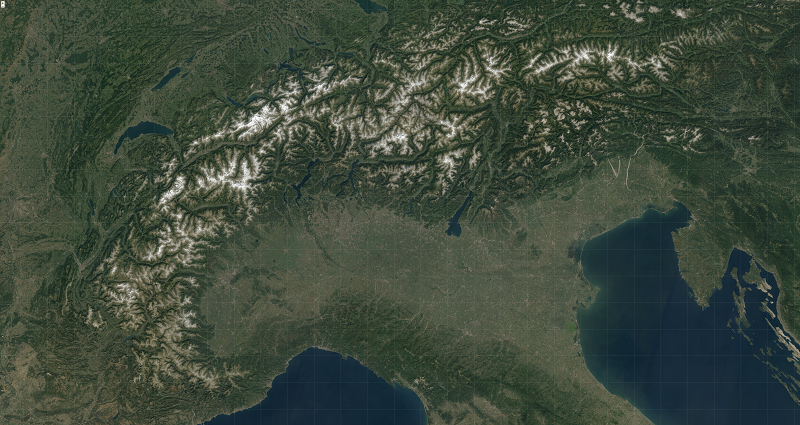
At the present time, the most popular data, due to its high performance and general accessibility, is the data received from images taken by the Landsat 8 satellite and Sentinel-2 pair of satellites. It is also worth noting that images from satellite data are taken in near spectral bands, which, in turn, simplifies its simultaneous analysis.
In the drawings below are fragments of composite coverage collected from data from Landsat 8 and Sentinel-2, 2016–2017.